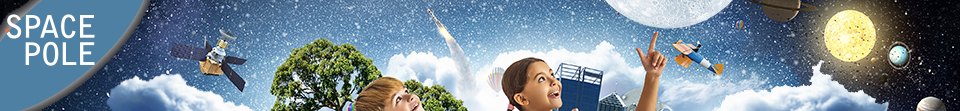
Belgian
Institute
for Space
Aeronomy
|
2. The Earth's trapped radiation environment
2.4 Dynamics of the trapped particle population
2.4.3 Low altitude trapped proton anisotropy
| At
low altitudes (typically below 2,000 km), trapped particles
interact with the neutral atmosphere. The gyroradii
of trapped protons with energies above 1 MeV are comparable
to the atmospheric scale height, which means that during
a gyration motion they encounter different atmospheric
densities. As a result, proton fluxes depend on their
arrival direction in the plane perpendicular to the
local magnetic field vector (as well as on their pitch
angle). The resulting anisotropy is called the East-West
effect, and can cause differences of a factor three
or more in fluxes arriving from different azimuths.
The effect is illustrated in figure 6, which shows the
angular dependence of the AP-8 MAX integral proton flux
>10 MeV, averaged over an 800 km geosynchronous orbit. |
 |
Figure
6. Angular dependence of the AP-8 MAX integral
proton flux >10 MeV, averaged over an 800 km geosynchronous
orbit. Angles are measured in a reference frame
with its polar axis parallel to the satellite
velocity vector. |
|
2.4.4 Magnetospheric conditions
| Besides
the long term variations in the trapped particle
population described in Sections 2.4.1-2.4.2,
variations on much shorter time scales occur as
well. Outer zone electrons can vary in intensity
by orders of magnitude over periods of a few hours.
Measurements with instruments onboard the Combined
Release and Radiation Effects Satellite (CRRES)
have shown that there are also major changes in
the spatial distributions of outer zone electrons
(10). Gussenhoven
et al. (11) have
shown that the changes in flux and spatial distribution
can be ordered by level of magnetospheric activity,
i.c. the fifteen day running average of Ap. Figure
7 shows omnidirectional electron flux profiles
on the magnetic equator as a function of McIlwain's
L (12) for six
ranges of Ap15. |
|
|
Figure
7. Profiles of 1.6 MeV (top) and 5.5 MeV
(bottom) omnidirectional electron flux
on the magnetic equator, as a function
of L, taken from the CRRES electron models
for six ranges of Ap15 (11).
|
|
|
 |
| Figure
8. Profiles of 4 MeV (top) and 41 MeV (bottom)
omnidirectional proton flux on the magnetic
equator, as a function of L, obtained with
the CRRES quiet and active proton models
and with AP-8 MAX (11).
|
|
CRRES
Data also demonstrated that magnetic storms can
greatly influence the trapped proton population
(13). The March
1991 storm created a second, stable high energy
belt above L=1.8, with peak flux values exceeding
pre-storm values by an order of magnitude (11),
as shown in figure 8.The
newly-created proton belt decayed only very slowly
and was still present six months later when the
CRRES satellite was lost. |
|
Back to "Overview
of radiation belt modeling"
|